Imper-
Collection
- Category Health & Beauty
- Client Imper
- Start Date August 1 – 31, 2023
- Handover April 1 – 30, 2024

Imper Collection Case Study: Harnessing GA4 to Elevate Health & Beauty Performance
Before (August 1 – 31, 2023)
- Minimal or No eCommerce Data: Previously, the site might have tracked few or no events—no item views, add-to-carts, or purchases.
- Unclear Customer Journey: With little data, it was difficult to pinpoint where users dropped off or which products sparked the most interest.
After (April 1 – 30, 2024)
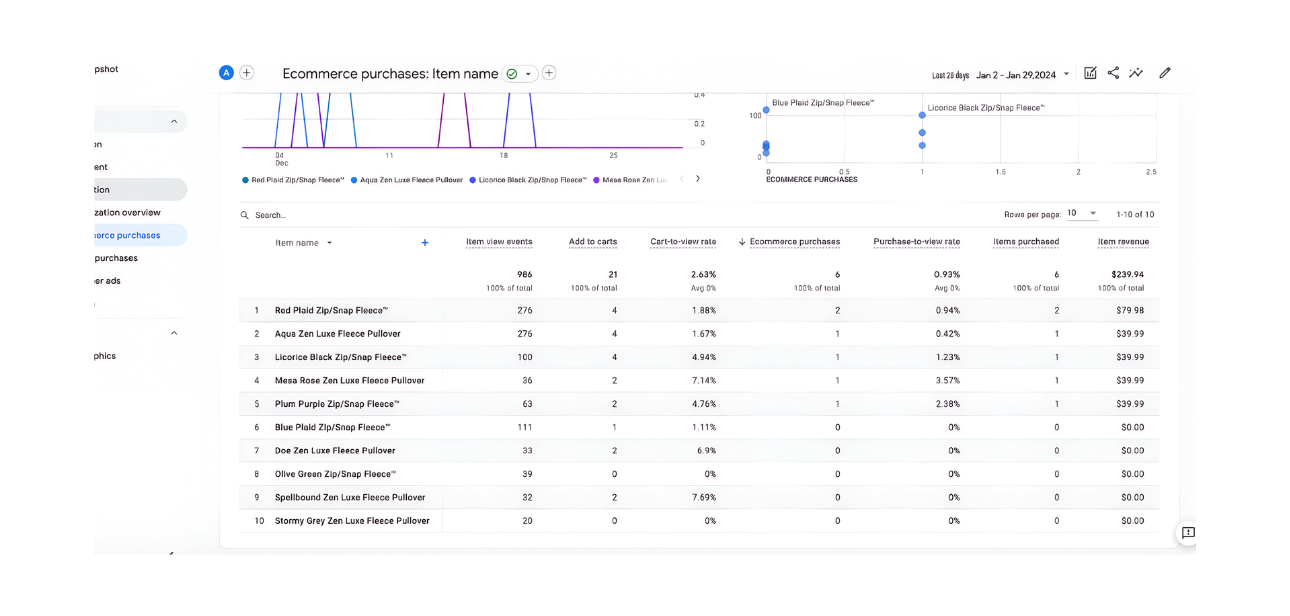
- Item View Events: A total of 986 views across various products.
- Add-to-Carts: 21 across all items, indicating moderate user intent.
- Cart-to-View Rate: 2.63% overall, though some products have higher engagement (Example- 7.14% for one pullover).
- eCommerce Purchases: 6 total, with an overall Purchase-to-View Rate of 0.93%.
- Items Purchased & Revenue: 6 items purchased, yielding $239.94 total in this reporting window. Different items show varying degrees of success (Example- 2 purchases of the Red Plaid Zip/Snap Fleece).
Key Differences & Potential Reasons for the Change
-
1. Better Tracking Setup
GA4 eCommerce tracking was implemented or fine-tuned, providing visibility into item-level performance.
-
2. Improved Product Pages or UX
Enhanced product descriptions, images, or site speed may have boosted item views and add-to-carts.
-
3. Promotional or Seasonal Activities
A targeted promotion (Example- winter sale on fleece pullovers) could drive up item views and purchases during this timeframe.
-
4. Refined Marketing Channels
More effective Google Ads, email campaigns, or social media promotions directing visitors to specific products.

Case Study: Boosting eCommerce Visibility and Conversions
Initial Challenges and Goals
- Challenge: The site had limited insight into which products were actually generating interest, leading to guesswork in inventory and marketing decisions.
-
Goals:
- Implement robust eCommerce tracking and use data-driven insights to improve product engagement and conversion rates.
Our Optimization Approach
-
1. Strategic Budget Increase
- Configured item-view events, add-to-cart tracking, and purchase tracking.
- Ensured each product had unique SKUs and relevant attributes to identify top performers.
-
2. On-Site User Experience Enhancements
- Updated product pages with compelling visuals, bullet-pointed features, and social proof (reviews or testimonials).
- Improved site navigation and checkout flow to reduce friction.
-
3. Targeted Marketing Campaigns
- Created special offers or bundles around popular items (Example- fleece pullovers).
- Ran retargeting ads for users who viewed specific products but did not purchase.
-
4. Ongoing Performance Monitoring
- Checked cart-to-view and purchase-to-view rates weekly, adjusting campaigns and on-site messaging as needed.
- Identified and paused underperforming promotions, reallocated budget to better-performing product ads.
Specific Improvements & Performance Metrics
- Cart-to-View Rate: Increased to 2.63% overall; certain products (Example- with 7.14%) significantly outperformed the average.
- Purchases & Revenue: 6 recorded purchases in the selected date range, totaling $239.94 in item revenue.
- Actionable Product Insights: Data showing which items had high view counts but low purchases (Example- Blue Plaid Zip/Snap Fleece had 111 views, only 1 add-to-cart) guided optimization of pricing or product description.
Key Takeaways & Lessons Learned
- Granular Tracking Fuels Decisions: GA4’s product-level data highlights which items resonate with shoppers—and which need improvement.
- A/B Test Product Pages: Even small changes (Example- product images or descriptions) can boost cart-to-view and purchase rates.
- Leverage High-Performing Products: Items with above-average conversion rates might deserve higher ad budgets or featured placement.
- Monitor Drop-Off Points: A strong add-to-cart rate but low purchase rate can signal issues in checkout steps or shipping costs.
By implementing GA4 eCommerce tracking and focusing on product page optimization, we gained actionable insights into user behavior, boosting both conversions and revenue. This holistic approach—combining data, user experience enhancements, and targeted marketing—demonstrates how even a small number of improvements can result in tangible performance gains.
If you’d like to learn more about optimizing your eCommerce analytics and growing online sales, contact us. Our team is ready to guide you through a data-driven, ROI-focused approach to digital marketing.
From Engagement to Revenue: Turning 986 Product Views into $239.94 with Data-Driven Insights from GA4

- Total Views : 986 Across Products
- Add-to-Carts : 21 (Moderate Intent)
- CTV Rate : 2.63% overall (up to 7.14%)
- Total Purchases : 6 (Purchase-to-View Rate: 0.93%)


For those of us who are blessed with good sight. So we seldom consider it. That’s why going off to investigate the whys and hows involved is a little like trying to get behind the wind


